grafana
[security] allow_embedding = true
display name
${__field.labels.table_name}
Options
Instant 只取一个时间点
https://grafana.com/grafana/download
https://gitee.com/derek2468/grafana-dashboards
配置
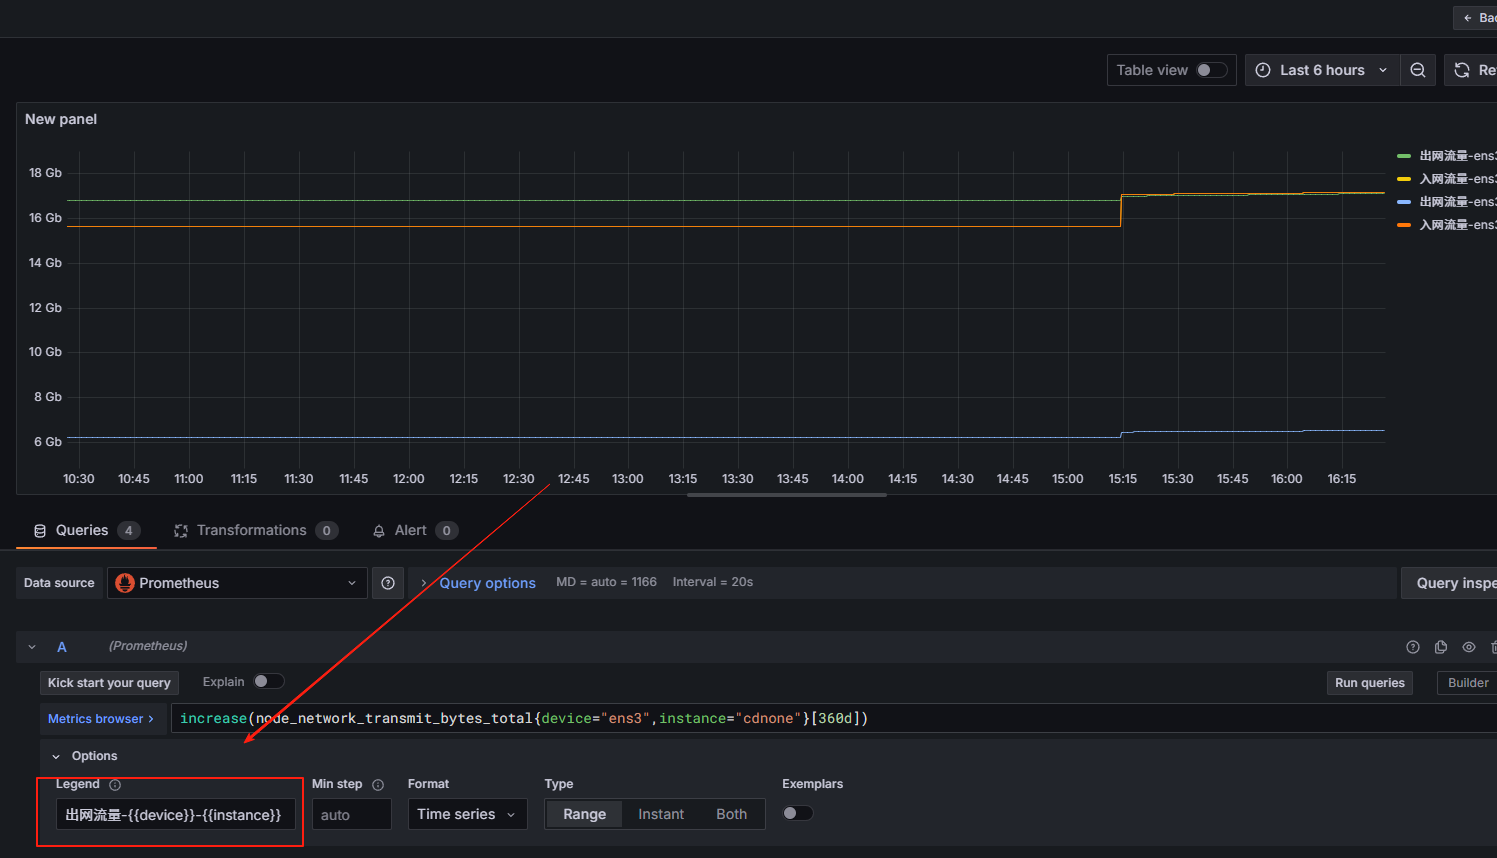
Legend
{{instance}} → 显示标签 instance 的值

{{device}} → 显示标签 device 的值
服务启动
nohup bin/grafana-server &


默认用户/密码: admin/admin
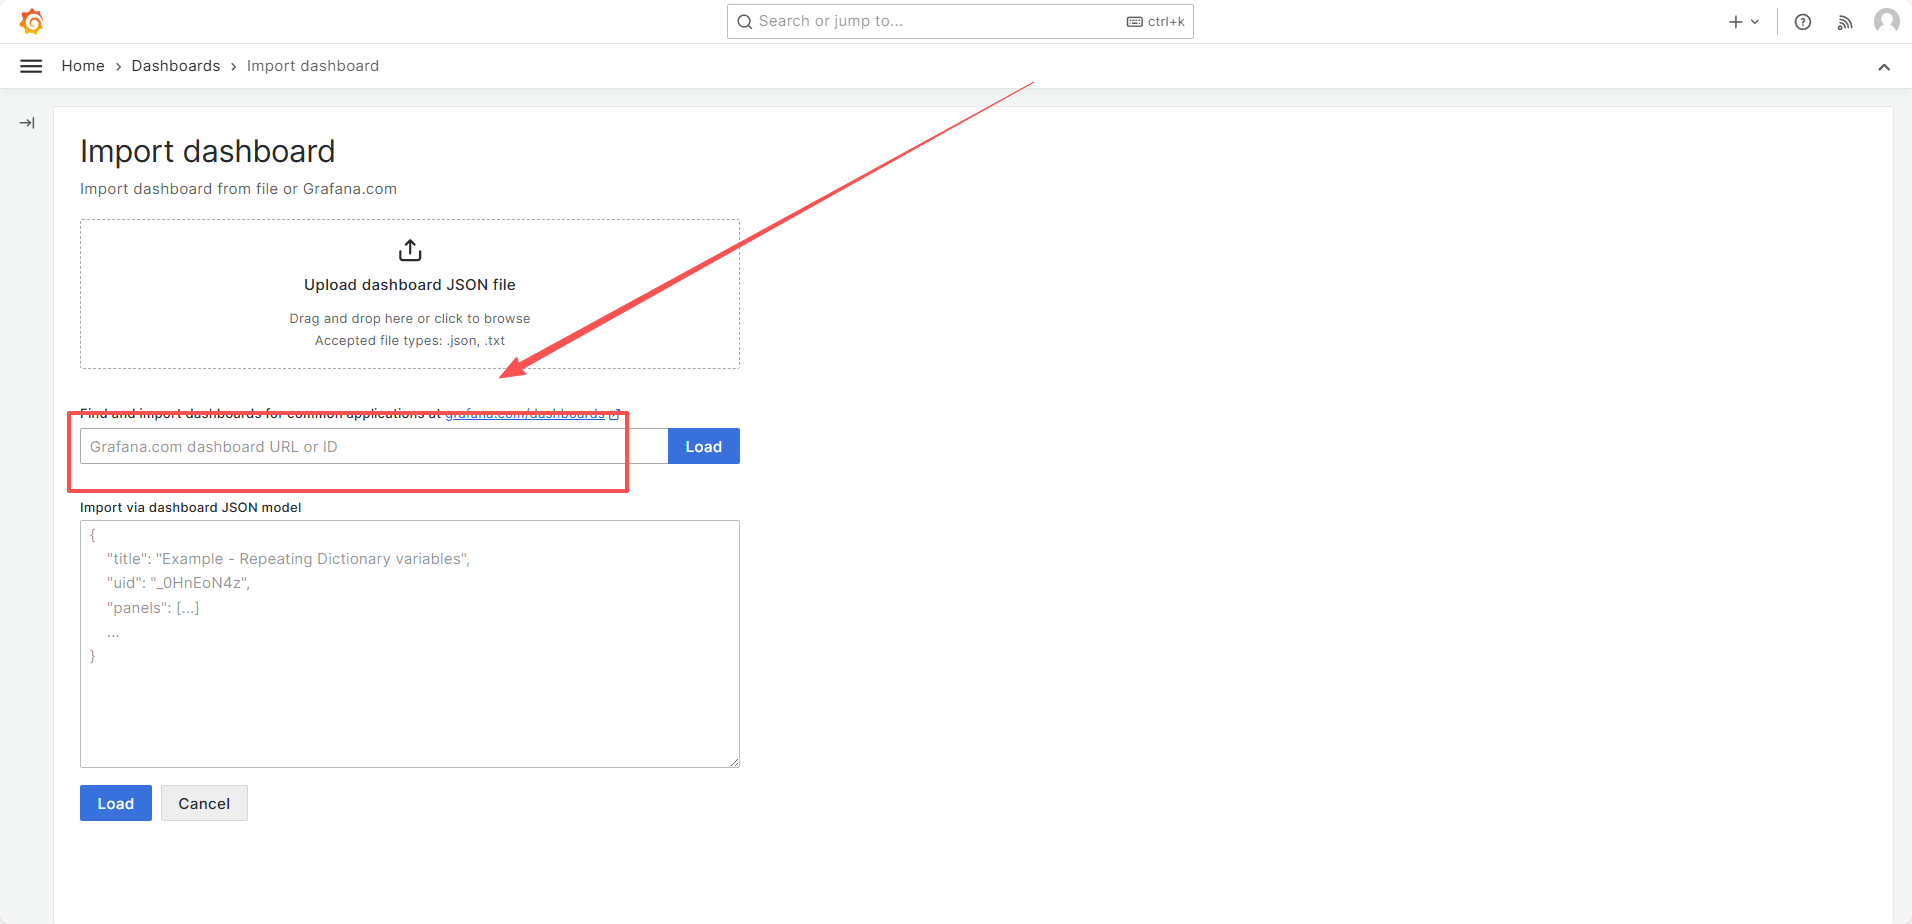
案例
https://grafana.com/grafana/dashboards/13659-blackbox-exporter-http-prober/
导入id
9965
with t as (
select
    table_name, concat(operate_type,'_', operate_status) as t,
    count(1) as num
 from schooletl_operate_log
 group by table_name, operate_type, operate_status
)
select
    table_name,
    max(case when t = 'append_finish' then num else 0 end) as 新增成功,
    max(case when t = 'append_waiting' then num else 0 end) as 新增等待,
  max(case when t = 'update_finish' then num else 0 end) as 更新成功
from t
group by table_name
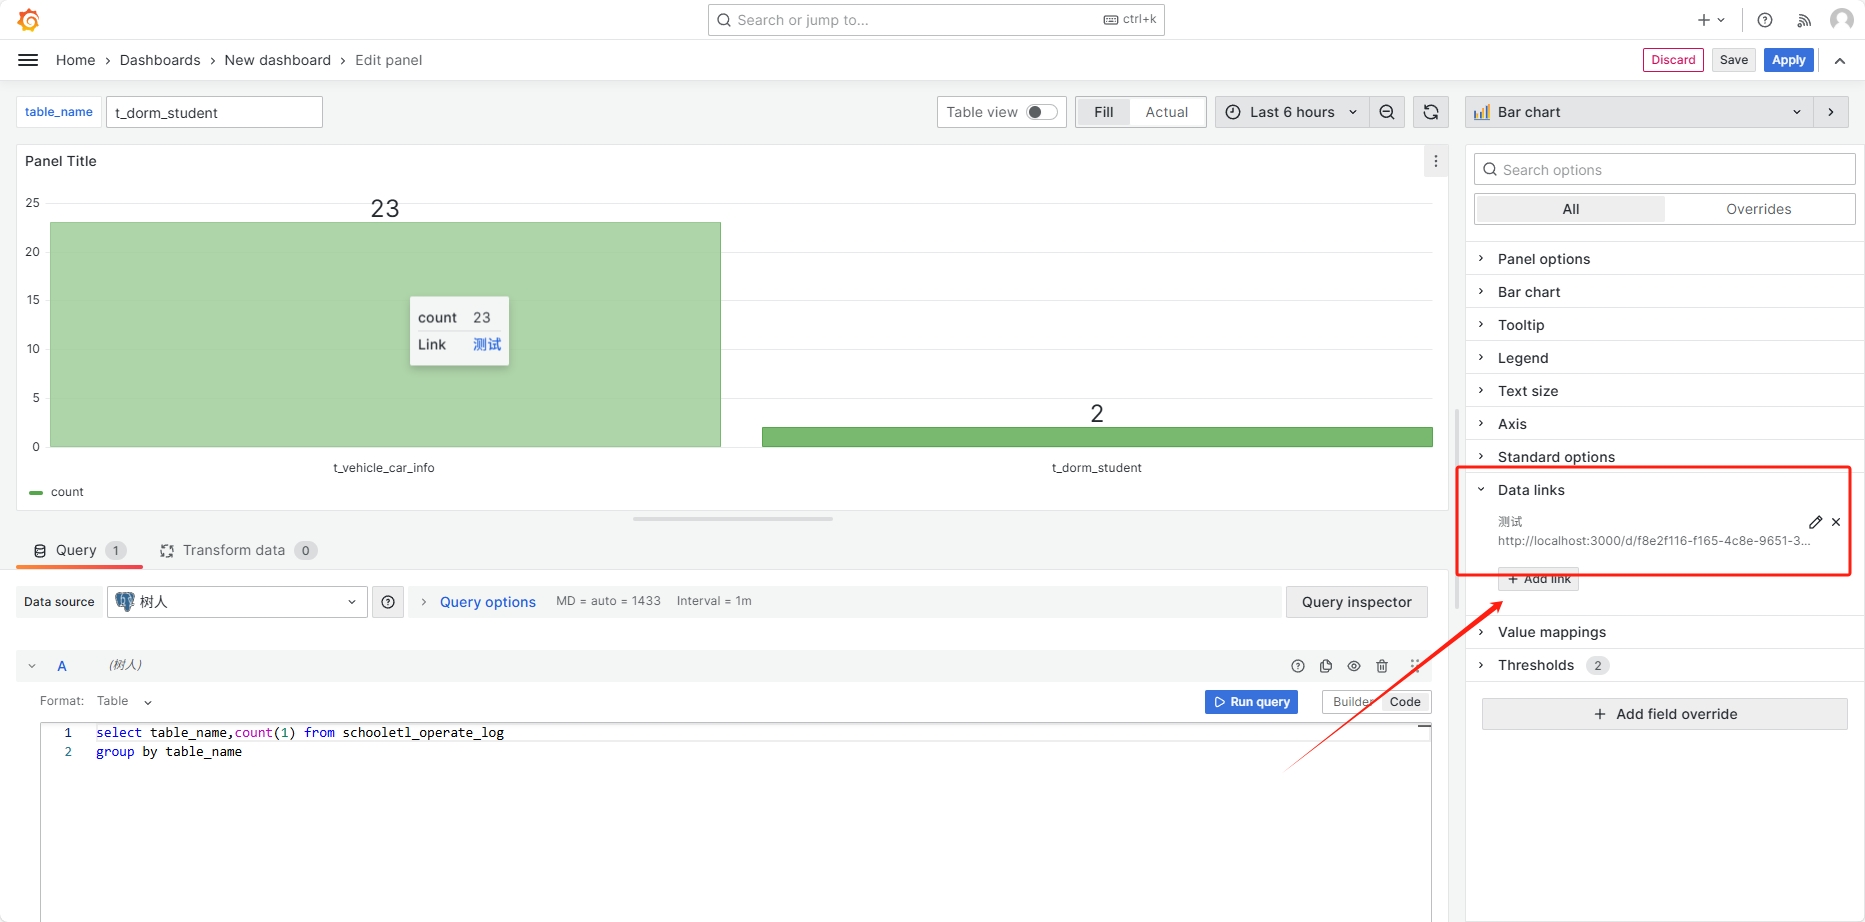
数据下钻
- 配置跳转链接
http://localhost:3000/d/f8e2f116-f165-4c8e-9651-358a8df1c733/new-dashboard?orgId=1&var-table_name=${__data.fields.table_name}
仪表盘地址: http://localhost:3000/d/f8e2f116-f165-4c8e-9651-358a8df1c733/new-dashboard?orgId=1
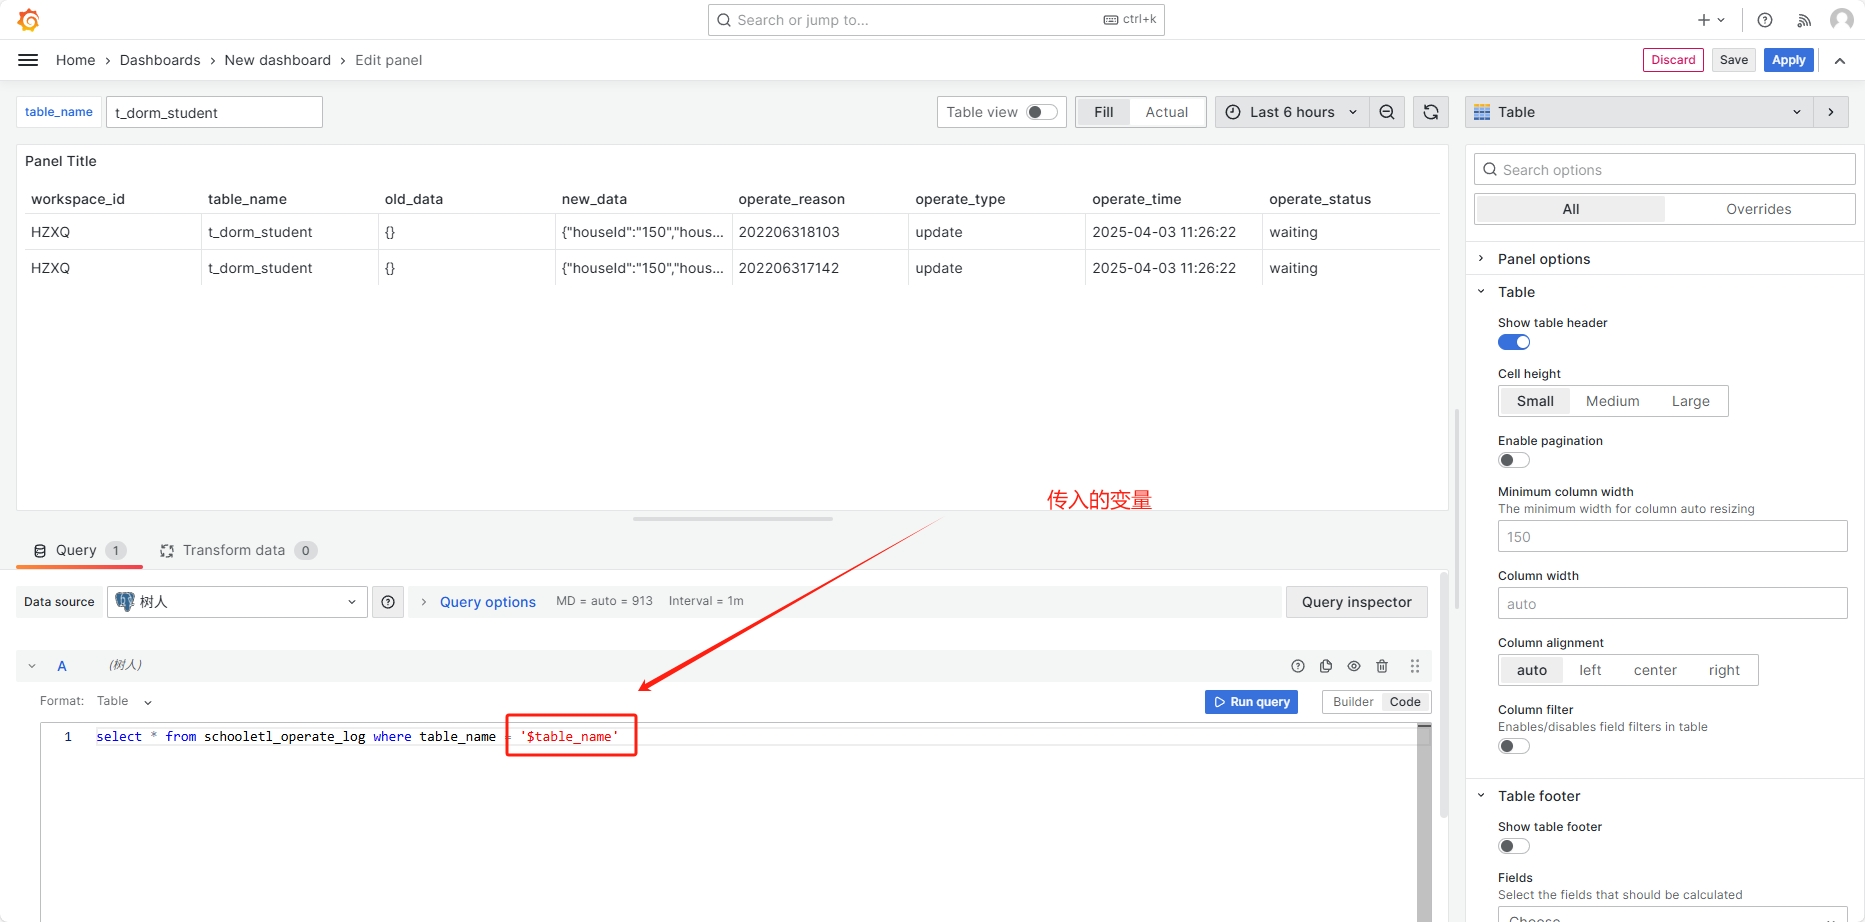
变量名称(定义变量名前加var-):var-table_name 传入的参数(输入$可进行选择):${__data.fields.table_name}
-
配置变量
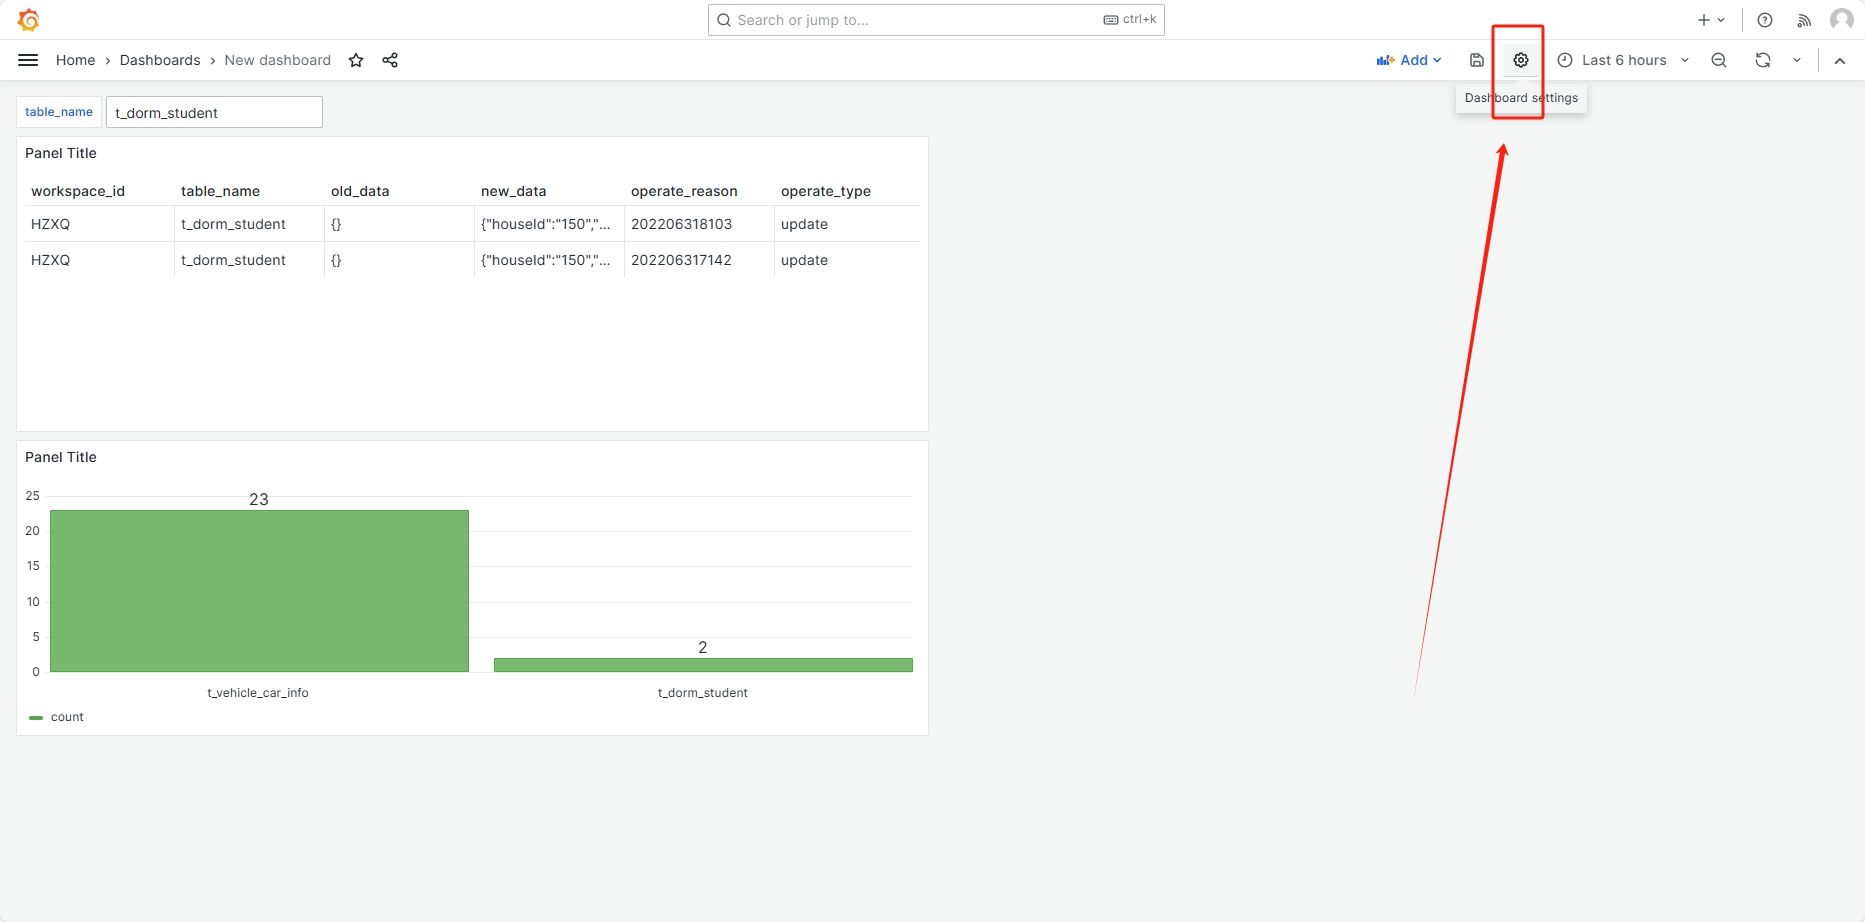
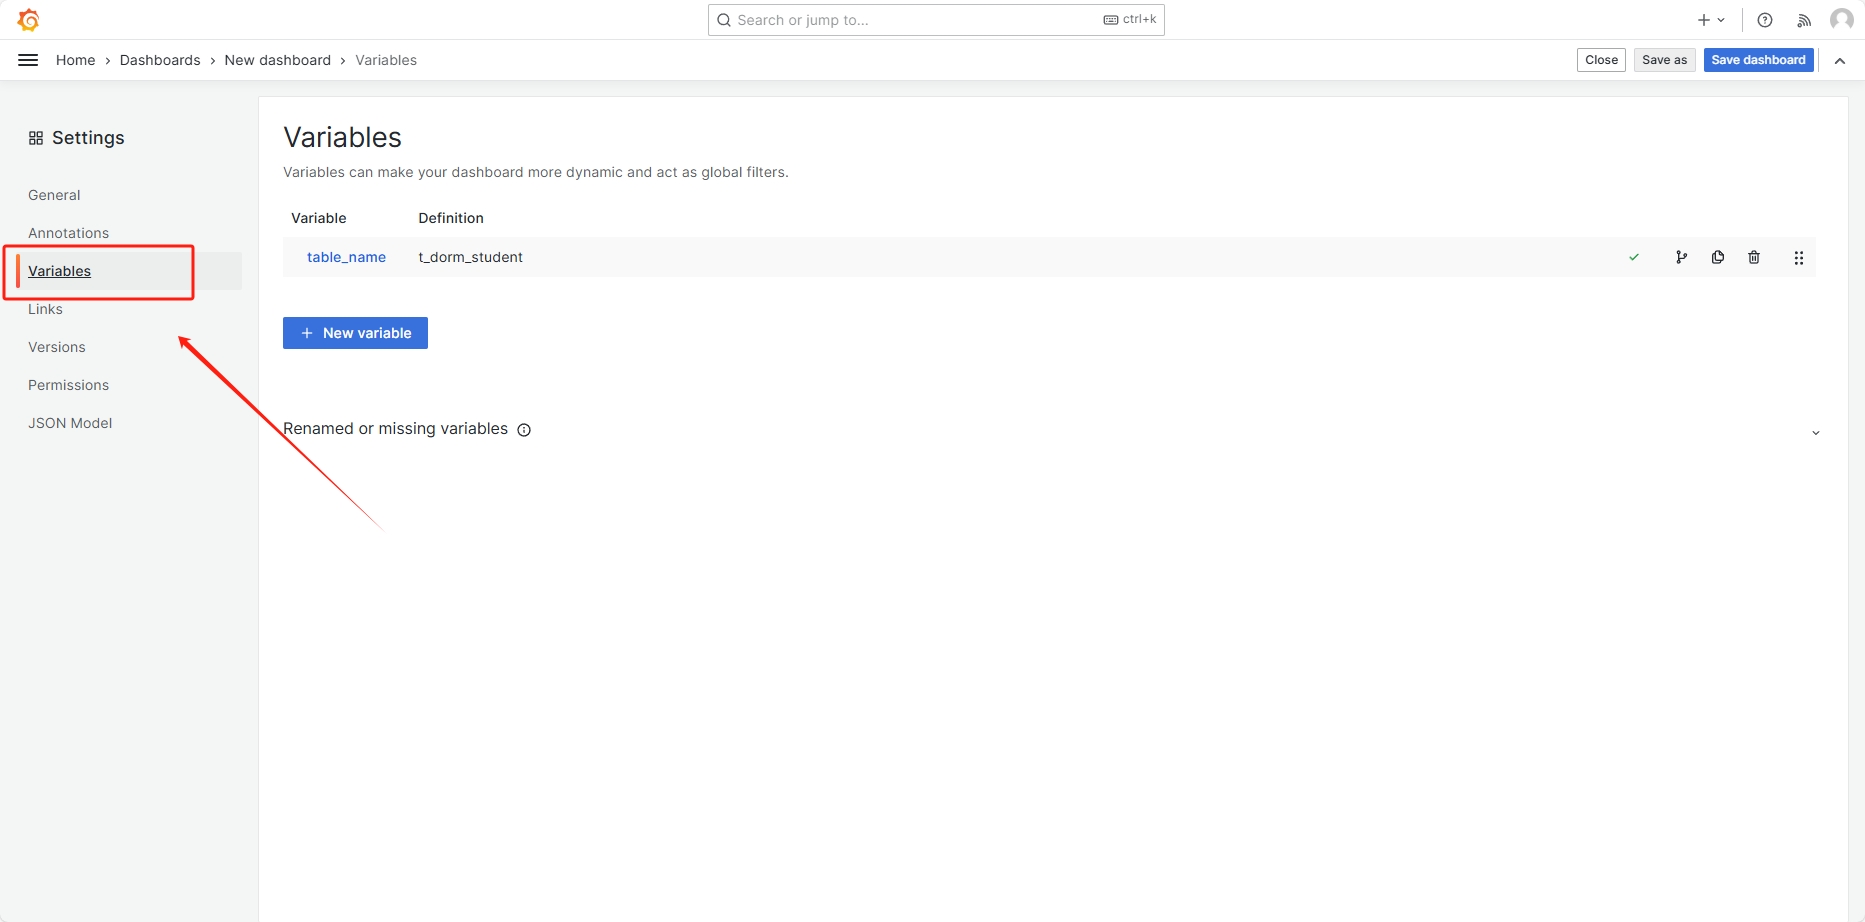
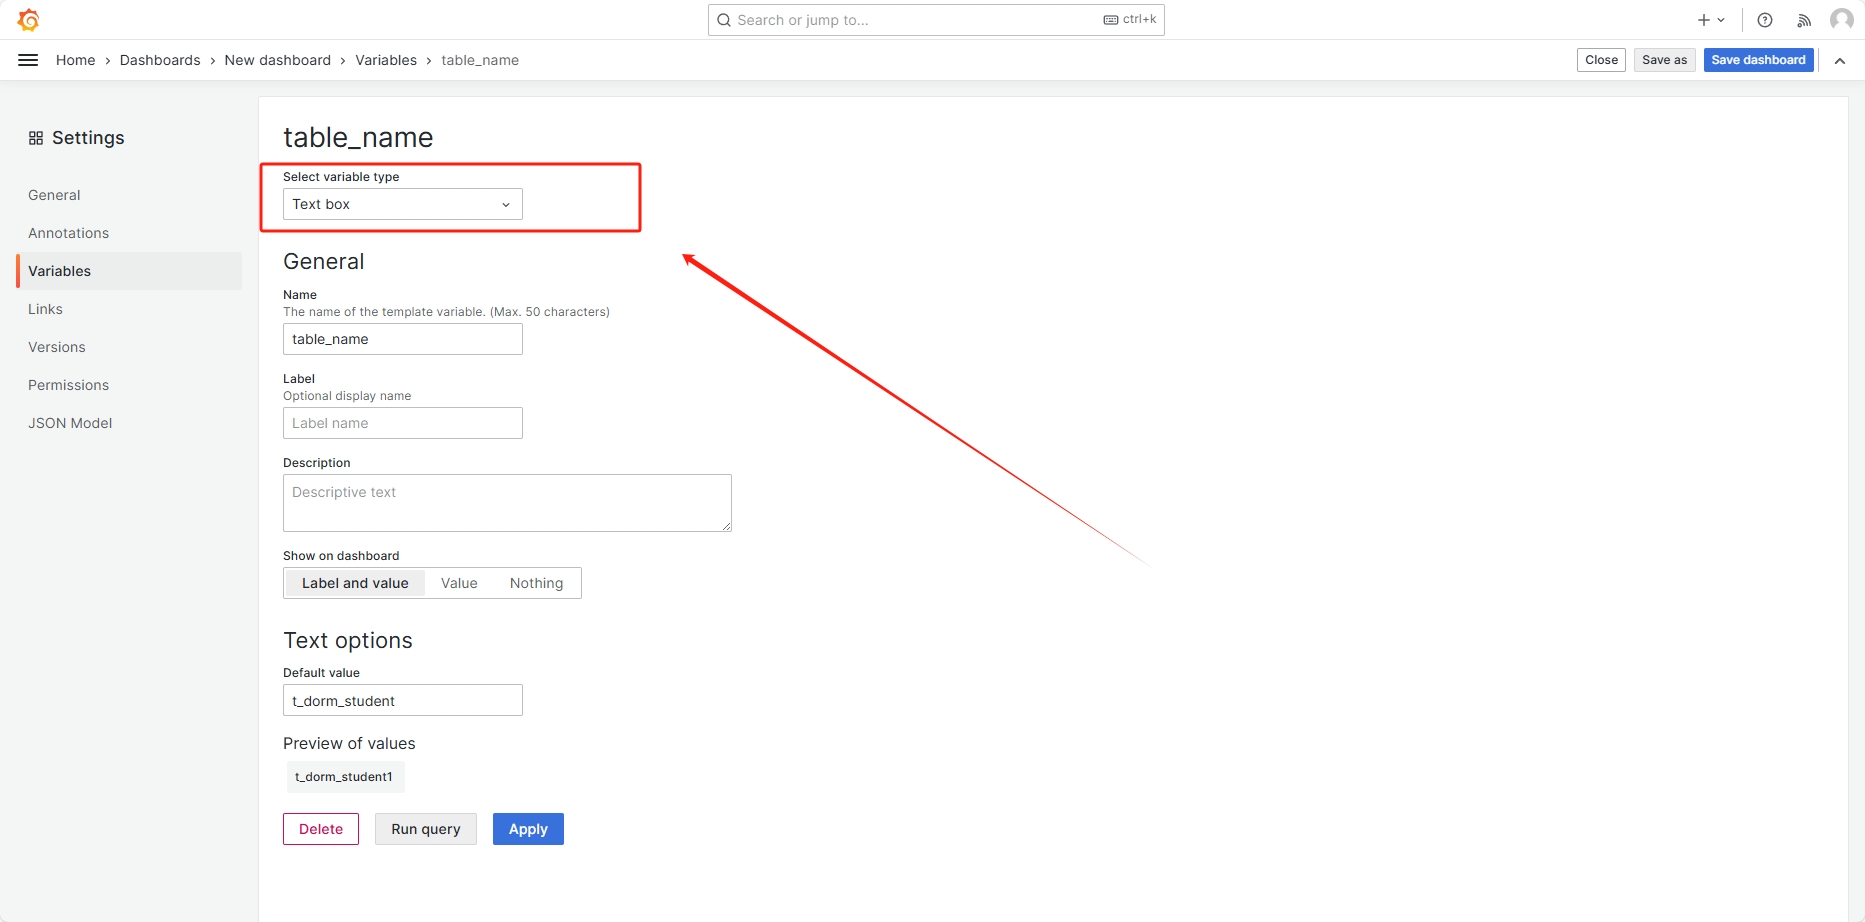
-
配置明细
插件
api数据源
sudo bin/grafana cli plugins install yesoreyeram-infinity-datasource
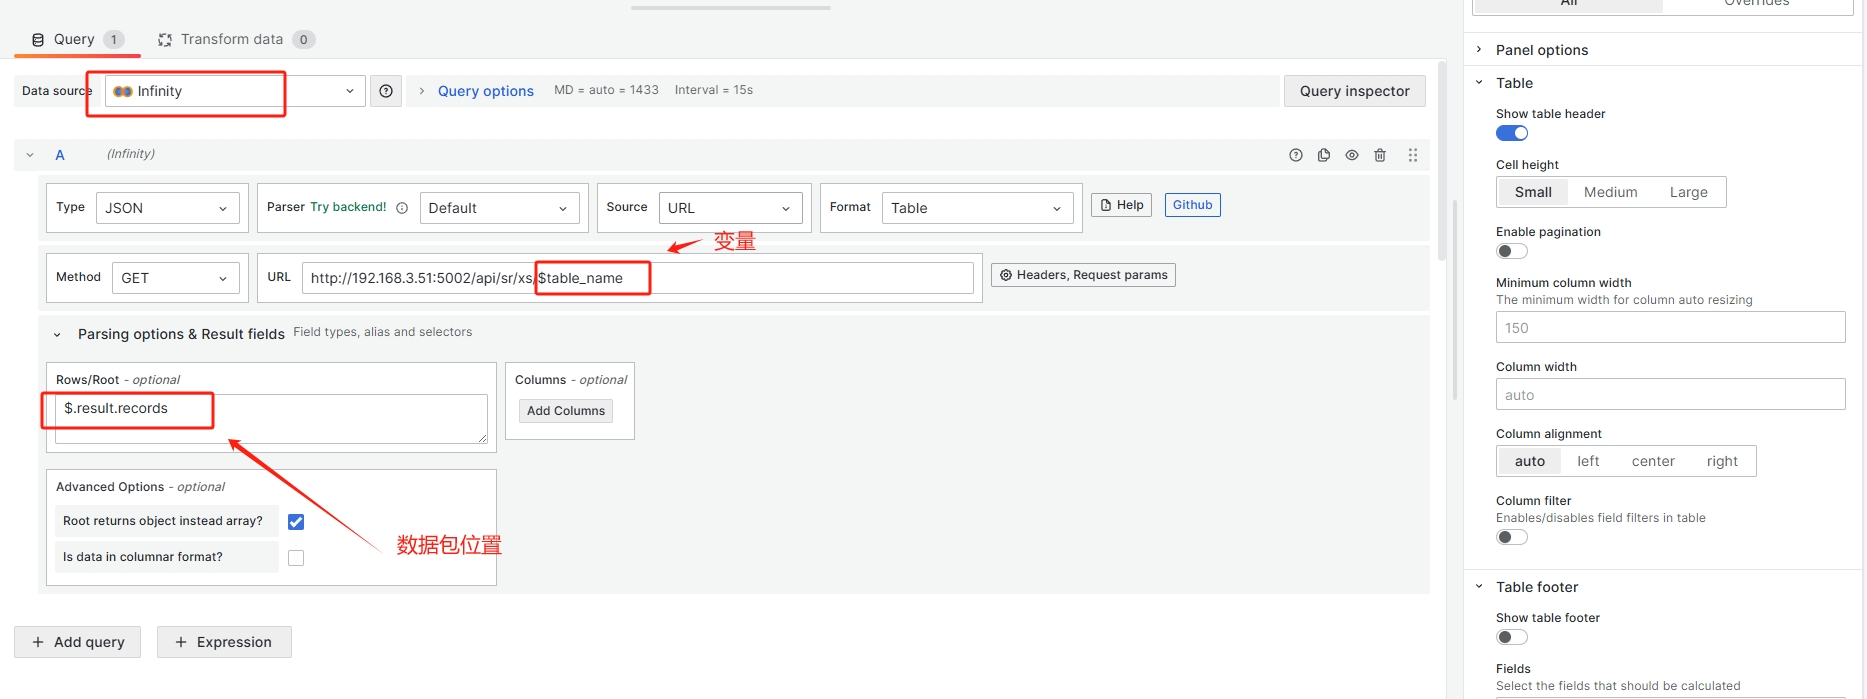
Query
样例
Node Exporter Full: ID 1860 (非常经典,包含系统概览)。 Process Exporter: ID 10613 或搜索 "Process Exporter" (专门展示按进程名分组的资源消耗)。