Prometheus
blackbox_exporter
The blackbox exporter allows blackbox probing of endpoints over HTTP, HTTPS, DNS, TCP, ICMP and gRPC.
blackbox-exporter的配置文件使用默认的即可(/usr/local/blackbox_exporter/blackbox.yml),文件里定义了进行目标检测时要使用的模块和模块参数。至于要检测哪些目标是定义在Prometheus 的Job配置中。
# Blackbox Exporter modules 配置文件
# 保存为 blackbox.yml,重启 blackbox_exporter 后生效
modules:

  # TCP 连接探测,适合检测任意 TCP 服务端口是否可达(无 HTTP 握手)
  tcp_connect_8000:
    prober: tcp
    timeout: 5s
    # tcp 探测可以配置发送/期望回复,但对常规端口检测通常不需要
    tcp:
      # 可选:如果服务会在连接后立即返回特定数据,可以配置 query/response
      # query: ""
      # response: ""

  # HTTP 探测(检查 2xx 响应 / 基本 HTTP 可用性),用于 web 服务的详细检查
  http_8000:
    prober: http
    timeout: 5s
    http:
      # 请求方法
      method: GET
      # 期望的有效状态码范围,若服务返回 200 则认为成功
      valid_status_codes: [200]
      # 如果希望接受 2xx/3xx/4xx 可根据需要调整,例如 [200,301]
      # valid_status_codes: [200,301]
      # 不跟随重定向(根据需要可改为 true)
      no_follow_redirects: false
      # 优先使用 IPv4(内部网络通常使用 IPv4)
      preferred_ip_protocol: "ip4"
      # 若服务使用 TLS 且内部证书不受信任,可以内网使用跳过校验
      tls_config:
        insecure_skip_verify: true
      # 可选自定义请求头
      headers:
        # Example:
        # Host: example.local
        # User-Agent: blackbox-probe
scrape_configs:

  - job_name: 'blackbox-192.168.3.51-8000-tcp'
    metrics_path: /probe
    params:
      module: [tcp_connect_8000]        # 使用 blackbox.yml 中的模块名
    static_configs:
      - targets: ['192.168.3.51:8000']  # 被探测目标 (target)
    relabel_configs:
      # 将 __address__(目标)传给 /probe 的参数 target
      - source_labels: [__address__]
        target_label: __param_target
      # 使用 target 值作为 instance 标签(可在 grafana/告警中显示)
      - source_labels: [__param_target]
        target_label: instance
      # 把实际的 scrape 地址改为 blackbox exporter 的地址
      - target_label: __address__
        replacement: 127.0.0.1:9115   # <-- 把这改为 blackbox_exporter 的地址:端口
Config
调试
--web.enable-lifecycle
http://192.168.3.12:9090/-/healthy
curl -X POST http://localhost:9090/-/reload
Rules
Note
Recording rule 只是生成指标,方便计算或绘图
Alerting rule 使用 recording rule 的指标,触发告警
- 规则配置
rule_files:
  - xxx.yml
- xxx.yml
groups:
- name: blackbox_service_alerts
  interval: 30s
  rules:
  - alert: ServiceDown
    expr: probe_success{instance="192.168.3.51:8000"} == 0
    for: 1m
    labels:
      severity: critical
    annotations:
      summary: "服务 192.168.3.51:8000 离线 服务监控"
      description: "服务心跳连续失败超过 1 分钟"
- 规则校验
promtool check rules /path/to/example.rules.yml
Recording Rules
Alert Rules
| 操作符 | 含义 | 示例 |
|---|---|---|
= |
精确匹配 | instance = "localhost:9100" |
=~ |
正则表达式匹配 | instance =~ "localhost:.*" |
exporter
postgres_exporter
export DATA_SOURCE_NAME=postgresql://postgres:Pgsql%402024@localhost:5432/postgres?sslmode=disable
scrape_configs:
  - job_name: postgres_exporter
    static_configs:
      - targets: ["localhost:9187"]
--extend.query-path=queries.yaml
table_size:
  query: |
    SELECT
      schemaname,
      relname AS table_name,
      pg_total_relation_size(relid) AS bytes
    FROM pg_stat_user_tables;
  metrics:
    - schemaname:
        usage: "LABEL"
    - table_name:
        usage: "LABEL"
    - bytes:
        usage: "GAUGE"
${__field.labels.table_name}
热加载配置 curl -X POST http://localhost:9090/-/reload 默认没有启用,需要在启动时指定 prometheus --config.file=/path/to/prometheus.yml --web.enable-lifecycle prometheus --web.enable-lifecycle
Status → Targets
增加标签
scrape_configs:
  - job_name: "prometheus"
    static_configs:
      - targets: ["localhost:9091"]
        labels:
          app: "prometheus"
  - job_name: node_exporter
    static_configs:
      - targets: ["localhost:9100"]
        labels:
          project: "公司内网服务器"
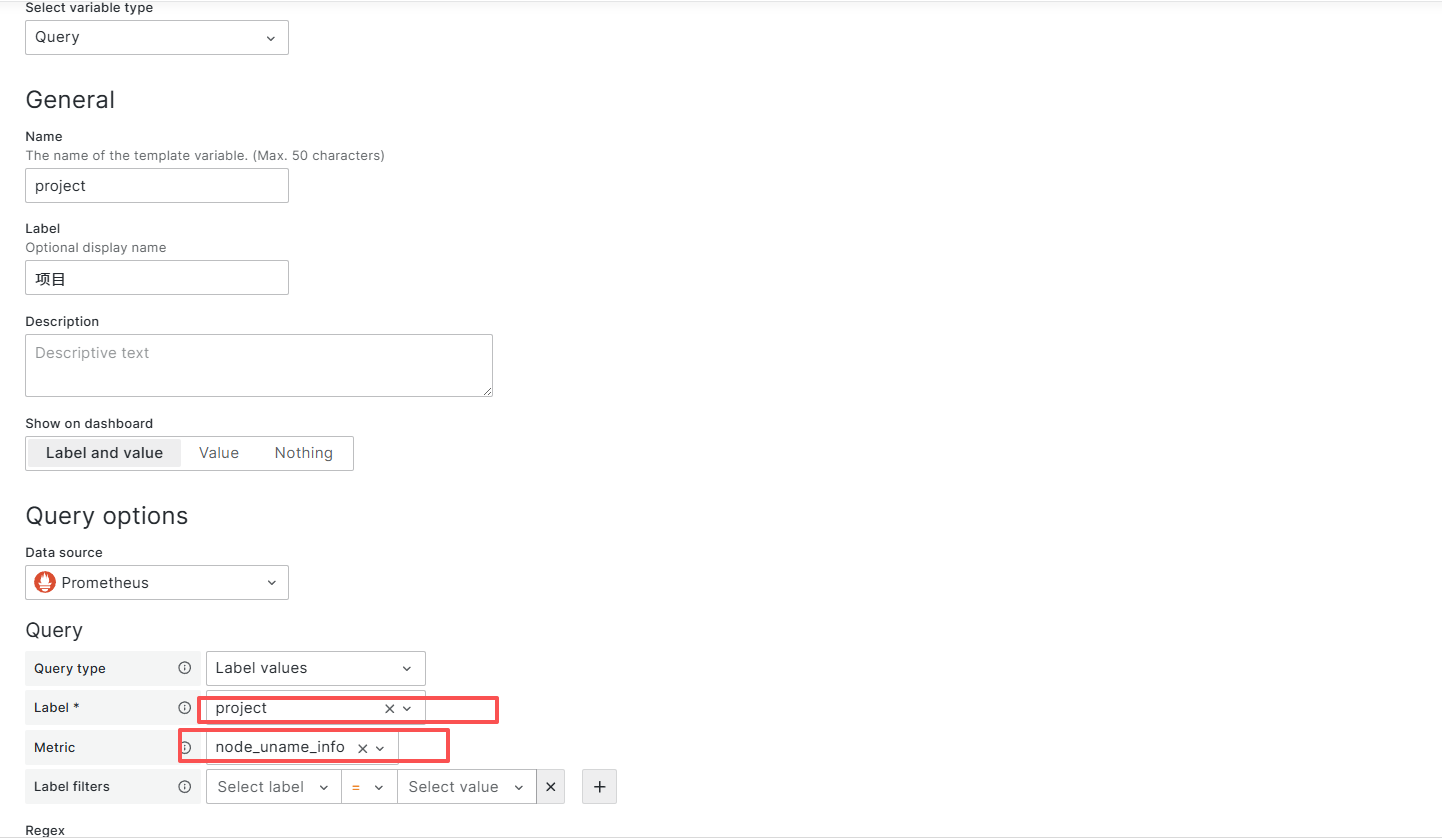
- grafana 定义变量
api
import requests
import json

# Prometheus API 地址
PROM_URL = "http://103.118.40.237:30090/api/v1/query"


def get_prometheus_metric(query):
    try:
        response = requests.get(PROM_URL, params={'query': query}, timeout=10)
        response.raise_for_status()
        data = response.json()

        if data['status'] != 'success' or not data['data']['result']:
            print("没有获取到数据")
            return None

        # 提取指标值
        value = data['data']['result'][0]['value']
        timestamp = value[0]
        metric_value = round(int(value[1]) / 1024 /1024 / 1024, 2)

        print(f"时间戳: {timestamp}, 指标值: {metric_value}")
        return metric_value

    except requests.RequestException as e:
        print(f"请求 Prometheus 失败: {e}")
        return None


if __name__ == "__main__":
    # 查询表达式
    query = 'increase(node_network_transmit_bytes_total{device="ens3",instance="cdnone"}[360d])'
    r = get_prometheus_metric(query)
    query = 'node_network_transmit_bytes_total{device="ens3",instance="cdntwo"}'
    r2 = get_prometheus_metric(query)
    msg = f"\U0001F4BB服务器: cdnone  \U0001F6DC当前出网流量总计: {r} G \n\U0001F4BB服务器: cdntwo  \U0001F6DC当前出网流量总计: {r2} G"
mysqld_exporter
# 配置mysqld_exporter
[client] user=root password=Mysql@2023 port=3306
# 启动mysqld_exporter
监控数据量大小
./mysqld_exporter --web.telemetry-path=/metrics --collect.info_schema.innodb_tablespaces
mysql_info_schema_innodb_tablespace_file_size_bytes


https://github.com/prometheus/mysqld_exporter


模糊查询使用 ~
mysql_info_schema_innodb_tablespace_file_size_bytes{instance="192.168.3.204:9104", job="mysql-105", tablespace_name=~"cs.*"}


# prometheus 配置

  - job_name: 'mysql-105'      # 给被监控主机取个名字
    static_configs:
    - targets: ['192.168.3.204:9104']      # 这里填写被监控主机的IP和端口
Systemd
prometheus.service
[Unit]
Description=Prometheus
Wants=network-online.target
After=network-online.target

[Service]
User=prometheus
Group=prometheus
Type=simple
ExecStart=/opt/prometheus-3.6.0-rc.0.linux-amd64/prometheus --config.file=/opt/prometheus-3.6.0-rc.0.linux-amd64/prometheus.yml --storage.tsdb.path=/opt/prometheus-3.6.0-rc.0.linux-amd64/data/ --web.enable-remote-write-receiver

[Install]
WantedBy=default.target
node-exporter.service
[Unit]
Description=Node Exporter
Wants=network-online.target
After=network-online.target

[Service]
User=node_exporter
Group=node_exporter
Type=simple
ExecStart=/usr/local/bin/node_exporter

[Install]
WantedBy=default.target
postgresql-exporter.service
[Unit]
Description=Prometheus PostgreSQL Exporter
After=network.target postgresql.service

[Service]
Type=simple
User=postgres_exporter
Group=postgres_exporter

# 转义 % 字符
Environment="DATA_SOURCE_NAME=postgresql://postgres:Pgsql%%402024@172.31.24.131:5432/postgres?sslmode=disable"

ExecStart=/data/soft/postgres_exporter-0.18.1.linux-amd64/postgres_exporter \
  --extend.query-path=/data/soft/postgres_exporter-0.18.1.linux-amd64/queries.yaml

Restart=always
RestartSec=5

[Install]
WantedBy=multi-user.target
docker
prometheus
version: '3.8'

services:
  prometheus:
    image: prom/prometheus:latest
    container_name: prometheus
    restart: unless-stopped
    # 使用宿主机网络,方便直接访问宿主机上的 exporter (9100, 9256 等)
    # 这样 targets 就可以直接写 localhost:端口
    network_mode: "host"

    volumes:
      # 挂载配置文件
      - ./prometheus/prometheus.yml:/etc/prometheus/prometheus.yml:ro
      # 挂载数据目录 (持久化存储监控数据,防止重启丢失)
      - prometheus_data:/prometheus

    command:
      - '--config.file=/etc/prometheus/prometheus.yml'
      - '--storage.tsdb.path=/prometheus'
      - '--web.console.libraries=/etc/prometheus/console_libraries'
      - '--web.console.templates=/etc/prometheus/consoles'
      - '--storage.tsdb.retention.time=15d' # 数据保留15天,可根据磁盘调整
      - '--web.enable-lifecycle' # 允许通过 API 重载配置

volumes:
  prometheus_data:
prmetheus&node_exporter&process_exporter
在同一个 Docker 网络中,直接使用服务名作为地址
prometheus/prometheus.yml
global:
  scrape_interval: 15s
  evaluation_interval: 15s

scrape_configs:
  # 1. 监控 Prometheus 自身
  - job_name: 'prometheus'
    static_configs:
      - targets: ['localhost:9090']

  # 2. 监控 Node Exporter (宿主机硬件指标)
  - job_name: 'node-exporter'
    static_configs:
      - targets: ['node-exporter:9100']

  # 3. 监控 Process Exporter (各语言进程指标)
  - job_name: 'process-exporter'
    static_configs:
      - targets: ['process-exporter:9256']
version: '3.8'

services:
  # ==========================
  # 1. Prometheus (核心数据库)
  # ==========================
  prometheus:
    image: prom/prometheus:latest
    container_name: prometheus
    restart: unless-stopped
    ports:
      - "9090:9090"
    volumes:
      - ./prometheus/prometheus.yml:/etc/prometheus/prometheus.yml:ro
      - prometheus_data:/prometheus
    command:
      - '--config.file=/etc/prometheus/prometheus.yml'
      - '--storage.tsdb.path=/prometheus'
      - '--web.console.libraries=/etc/prometheus/console_libraries'
      - '--web.console.templates=/etc/prometheus/consoles'
      - '--storage.tsdb.retention.time=15d'
      - '--web.enable-lifecycle'
    depends_on:
      - node-exporter
      - process-exporter

  # ==========================
  # 2. Node Exporter (硬件监控)
  # ==========================
  node-exporter:
    image: quay.io/prometheus/node-exporter:latest
    container_name: node-exporter
    restart: unless-stopped
    # 不需要暴露端口给外部,Prometheus 内部访问即可
    # 如果需要外部访问 Grafana,可以解开 ports
    # ports:
    #   - "9100:9100"
    volumes:
      - /proc:/host/proc:ro
      - /sys:/host/sys:ro
      - /:/rootfs:ro
    command:
      - '--path.procfs=/host/proc'
      - '--path.sysfs=/host/sys'
      - '--collector.filesystem.mount-points-exclude=^/(sys|proc|dev|host|etc)($$|/)'

  # ==========================
  # 3. Process Exporter (进程监控)
  # ==========================
  process-exporter:
    image: quay.io/ncabatoff/process-exporter:latest
    container_name: process-exporter
    restart: unless-stopped
    privileged: true  # 必须特权模式以读取所有进程信息
    # ports:
    #   - "9256:9256"
    volumes:
      - /proc:/host/proc:ro
      - ./process-exporter:/config:ro
    command:
      - "--procfs=/host/proc"
      - "--config.path=/config/filename.yml"

# 数据持久化卷
volumes:
  prometheus_data:
process-exporter/filename.yml
process_names:
  # --- 常用语言监控规则 ---

  # Java
  - name: "{{.Comm}}"
    cmdline:
      - '.+/java.*'

  # Python (匹配 python, python3, python3.8 等)
  - name: "{{.Comm}}"
    cmdline:
      - '.+/python[0-9.]*.*'
      - 'python.*'

  # Node.js
  - name: "{{.Comm}}"
    cmdline:
      - '.+/node.*'

  # Go (通常编译为独立二进制,这里示例匹配包含 'go' 或特定应用名的进程)
  # 请根据你的实际二进制文件名修改正则,例如 'my-app'
  - name: "{{.Comm}}"
    cmdline:
      - '.*my-go-app.*'
      - '.+/go-build.*' # 临时匹配 go build 产生的进程

  # --- 通用规则 (慎用,可能会产生大量指标) ---
  # 如果上面的规则没匹配到,但你想监控所有其他用户进程,取消下面注释:
  # - name: "{{.Comm}}"
  #   cmdline:
  #     - '.+'